Cancer incidence rates of WHO global regions
Incidence.RdCancer incidence rates of WHO global regions.
Format
A list object of the five WHO global regions:
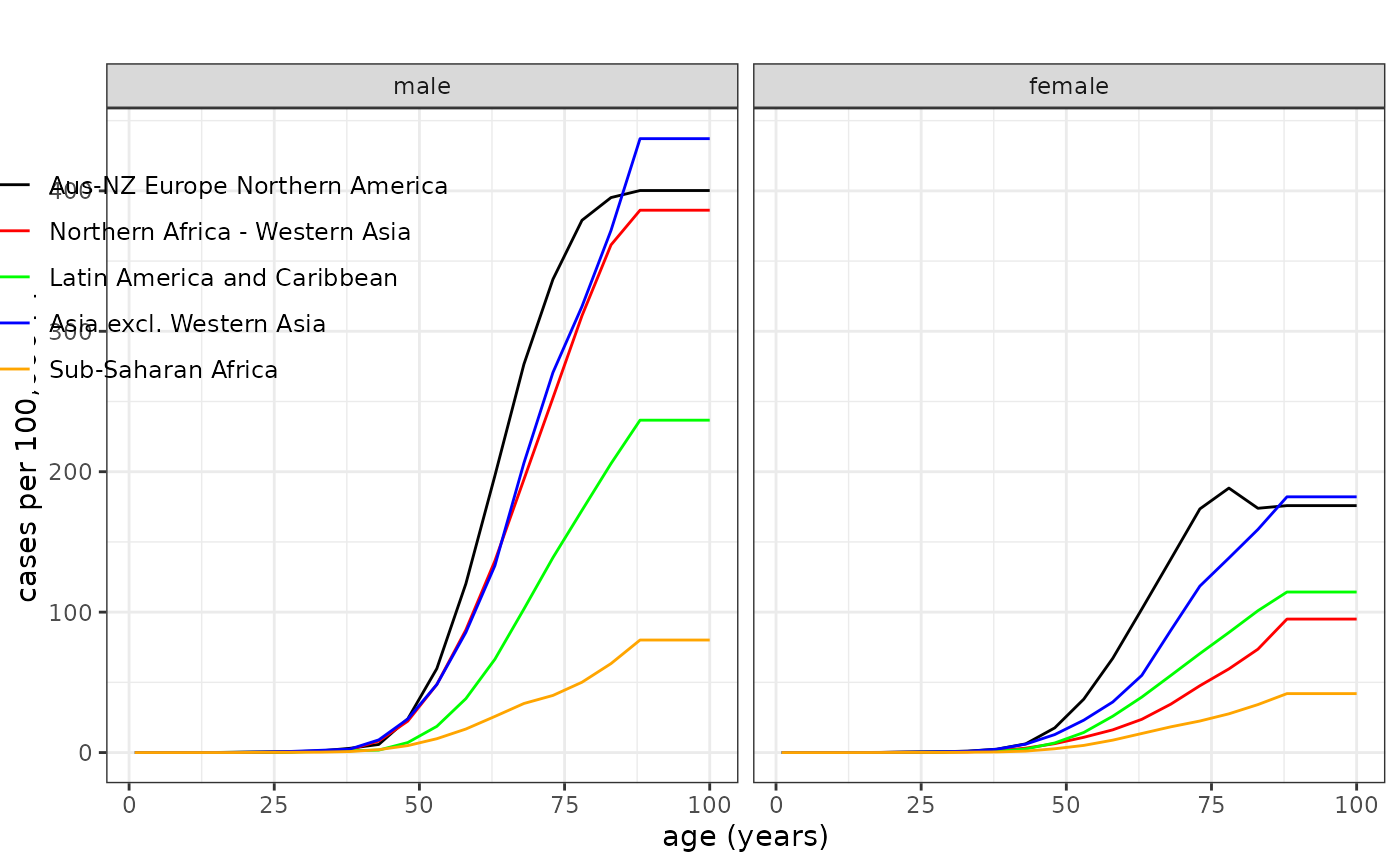
Aus-NZ Europe Northern Americaa list object of 18 items, each of which contains a data.frame of cancer rates (see Details)
Northern Africa - Western Asiaa list object of 18 items, each of which contains a data.frame of cancer rates (see Details)
Latin America and Caribbeana list object of 18 items, each of which contains a data.frame of cancer rates (see Details)
Asia excl. Western Asiaa list object of 18 items, each of which contains a data.frame of cancer rates (see Details)
Sub-Saharan Africaa list object of 18 items, each of which contains a data.frame of cancer rates (see Details)
Details
The list object for each region contains the 16 site-specific cancer mortality rates (esophagus, stomach, colon, liver, pancreas, lung, breast, prostate, bladder, brainCNS, thyroid, all_leukaemia, all_cancer, allsolid-NMSC, allsolid, leukaemia).
Each site-specific data.frame contains variables age, male and female.
Examples
 names(Incidence)       # WHO global regions
#> [1] "Aus-NZ Europe Northern America" "Northern Africa - Western Asia"
#> [3] "Latin America and Caribbean"    "Asia excl. Western Asia"
#> [5] "Sub-Saharan Africa"
 names(Incidence[[1]])  # Sites for which baseline incidence rates are available
#>  [1] "esophagus"     "stomach"       "colon"         "liver"
#>  [5] "pancreas"      "lung"          "breast"        "prostate"
#>  [9] "bladder"       "brainCNS"      "thyroid"       "all_leukaemia"
#> [13] "all_cancer"    "allsolid-NMSC" "allsolid"      "leukaemia"

 # Example 1: All solid cancer incidence rates for Region-1
 head( Incidence[[1]]$allsolid )
#>   age         male       female
#> 1   1 2.460574e-05 2.347254e-05
#> 2   2 7.381723e-05 7.041762e-05
#> 3   3 1.230287e-04 1.173627e-04
#> 4   4 1.131290e-04 1.083419e-04
#> 5   5 1.032292e-04 9.932113e-05
#> 6   6 9.332949e-05 9.030034e-05
 tail( Incidence[[1]]$allsolid )
#>     age       male     female
#> 95   95 0.03803944 0.02027876
#> 96   96 0.03803944 0.02027876
#> 97   97 0.03803944 0.02027876
#> 98   98 0.03803944 0.02027876
#> 99   99 0.03803944 0.02027876
#> 100 100 0.03803944 0.02027876

 # Example 2: Leukaemia incidence rates for Region-3
 head( Incidence[[3]]$leukaemia )
#>   age         male       female
#> 1   1 1.340418e-05 1.151570e-05
#> 2   2 4.021253e-05 3.454710e-05
#> 3   3 6.702088e-05 5.757850e-05
#> 4   4 6.363679e-05 5.417608e-05
#> 5   5 6.025271e-05 5.077365e-05
#> 6   6 5.686862e-05 4.737123e-05
 tail( Incidence[[3]]$leukaemia )
#>     age         male       female
#> 95   95 0.0004737154 0.0002890933
#> 96   96 0.0004737154 0.0002890933
#> 97   97 0.0004737154 0.0002890933
#> 98   98 0.0004737154 0.0002890933
#> 99   99 0.0004737154 0.0002890933
#> 100 100 0.0004737154 0.0002890933

 # Example 3: A;;ll;-cause incidence rates for Region-5
 head( Incidence[[5]]$allcause )
#> NULL
 tail( Incidence[[5]]$allcause )
#> NULL

 # Example 4: plotting lung cancer incidence rates
 plot_refdata( dat=Incidence, outcome="lung", leg_pos=c(0.27,0.95) )